The Air Aberdeen project came about as a result of separate conversations with two community groups (and those working with them) in areas to the North and South of the city. Each had a need to better understand the air quality in its immediate area.
Why Luftdaten?
Our partners, 57 North Hacklab, had looked at various options of sensor devices. The Luftdaten design, which had emerged in Germany, was a mature project which was widely accepted and used. At that point there were over 5,000 devices live across Europe.
A Luftdaten device measures two kinds of harmful particulates (PM10 and PM2.5) plus temperature and humidity. Its components were easy to procure at reasonable cost. It didn’t try to measure gaseous pollutants which can’t be done, currently, on lower-cost components. The chips which measure the particulate matter have been subject to various reviews [1], [2] and found to be accurate enough for the purpose. Additionally, the source code for the devices was open, and all data produced was made available as Open Data, which we think is essential.
Why do we need community sensors?
The city of Aberdeen covers 72 square miles, and has six official air quality sensors. These are large expensive, roadside devices which measure gaseous pollutants as well as particulate matter. With so few devices we have the situation that reported measures of air quality are, obviously, highly localised.
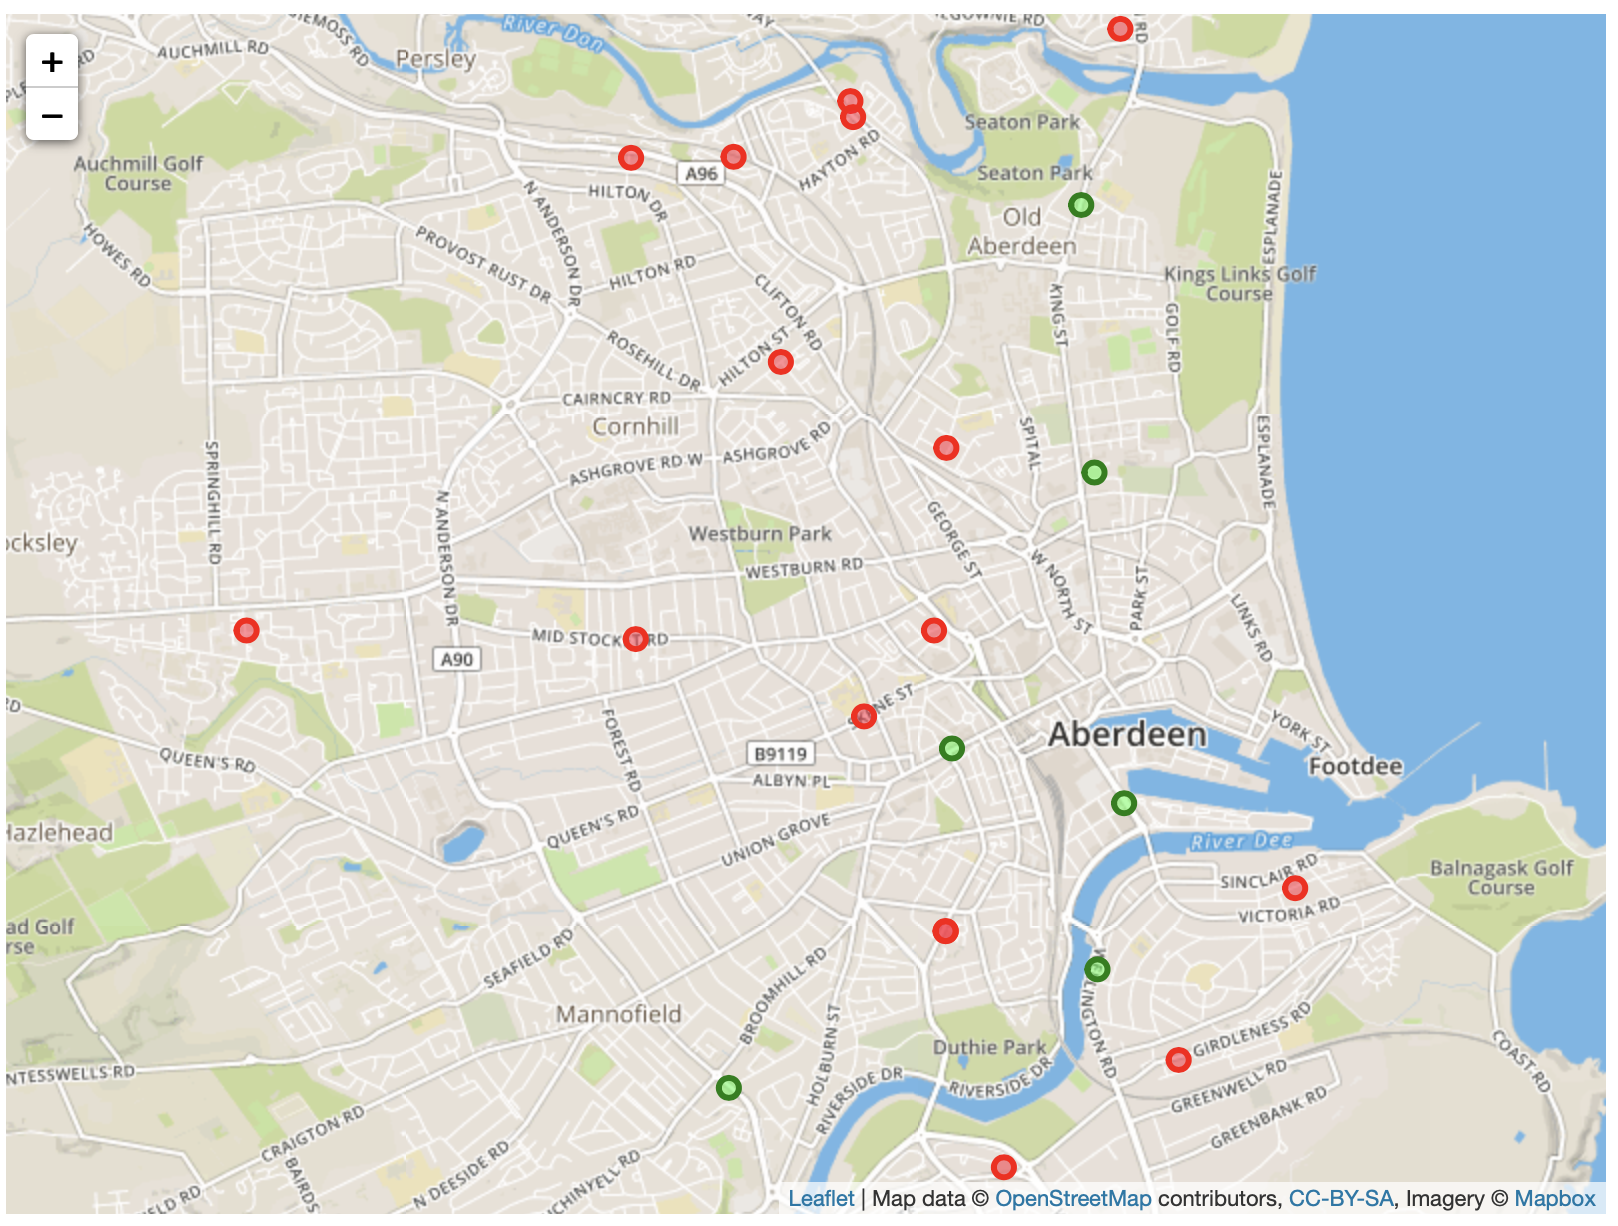
As may be seen from the map above (which shows only a part of Aberdeen, the official sensors (in green) do not cover much of the city, and our growing network of community devices (red) is starting to fill in the gaps.
Establishing the quality of air just 50 metres, or 500 metres from a sensor is impossible from official sources when they are so few and so far apart.
While the data from them can be found, with some difficulty, it is not openly licensed for reuse. Also the data that can be downloaded from the six sensors has averaged hourly readings, and is retrospective.
Councils face challenges
Local government funding is constrained as never before and departments in most cases have to focus on statutory service provision. This limits the opportunity to apply either funding or staff time to innovation.
Data Compared
We’ve calculated that the downloadable data from the official site above would give a total of 157,680 data observations, or measures per annum.
From 100 community sensors (our target for 2019) we would obtain 84,096,000 data observations per annum. That’s 533 times more data, with far more detail in it.
And, we may end up with double that number of devices!
So, by creating a network of local sensors, linked to an Europe-wide project which has now 27,000 sensors we can do not only more but better things.
The possibilities are great
We can
- fill in (huge) gaps between existing devices,
- capture highly-localised, or granular, AQ readings,
- capture data every 90 seconds instead of hourly for every device,
- make the data available openly, and
- encourage data reuse to build new things.
Those new things could include:
- data science-driven predictive models of forecast AQ in local areas,
- public health alerts,
- mobile apps to guide you where it is safe to walk, cycle, jog or suggest cleaner routes to school for children,
- logging AQ over time and measuring changes,
- correlating local AQ with admissions to hospital of cases of COPD and other health conditions
- inform debate and the formulation of local government strategy and policy.
We’ll be running more workshops and encouraging innovation.