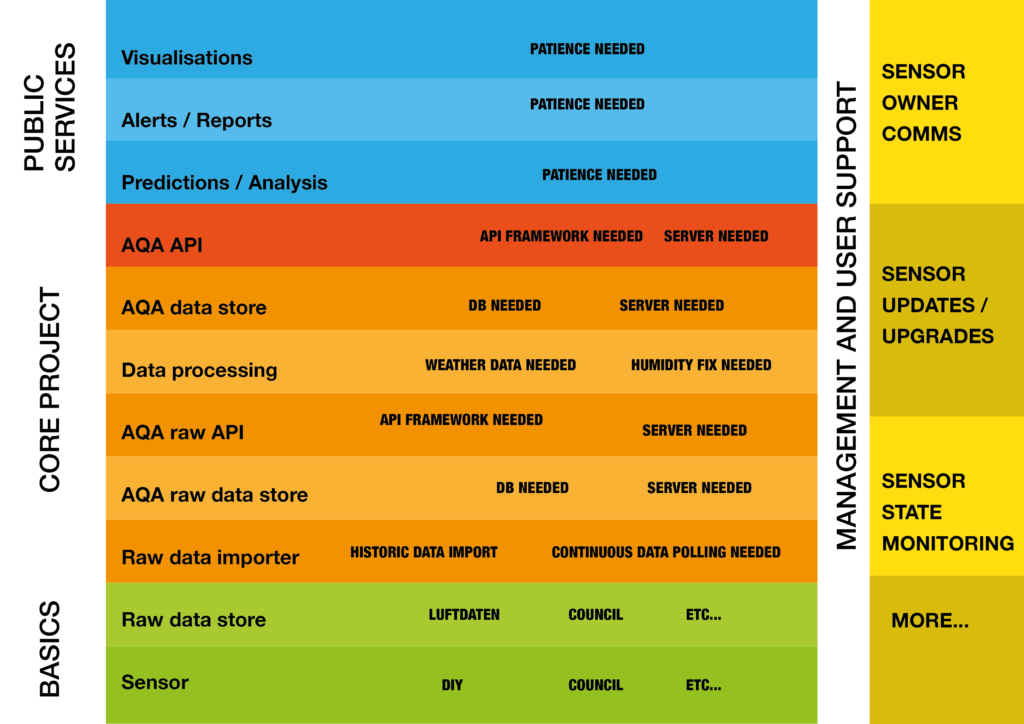
This diagram visualises the broad overall structure of the project, recognising the various aspects of data processing that are involved in creating a platform for analysis and visualisation.
This version of the diagram was developed on Sat 8th June, to reflect the work done to date, and to highlight the importance of the data processing layer.

Work on subsequent days will eliminate a number of the ‘needed’ labels. As new versions are required the link below is an editable PDF (use Illustrator or similar to edit) of the original diagram.